Spectral Graph Theory and Graph Signal Processing
Course description
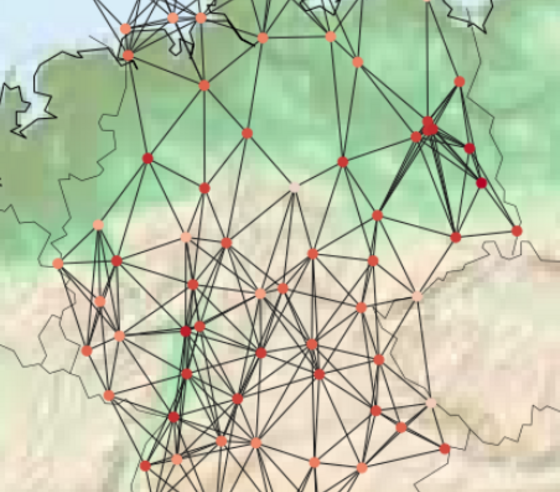
Many complex systems in the real-world can be appropriately modeled by graphs, e.g., social networks, traffic networks, sensor systems, chemical reaction networks to only name a few. Additionally, many methods from modern data science can be interpreted as working with fully connected, weighted graphs (e.g., when working with a Gaussian similarity function on arbitrary data sets).
Clearly, understanding properties of graphs thus helps tremendously when trying to find crucial properties of these real-world systems. There are countless ways how to analyze graphs, and in the first part of this course we focus on a particularly elegant approach which connects graph theory and linear algebra:
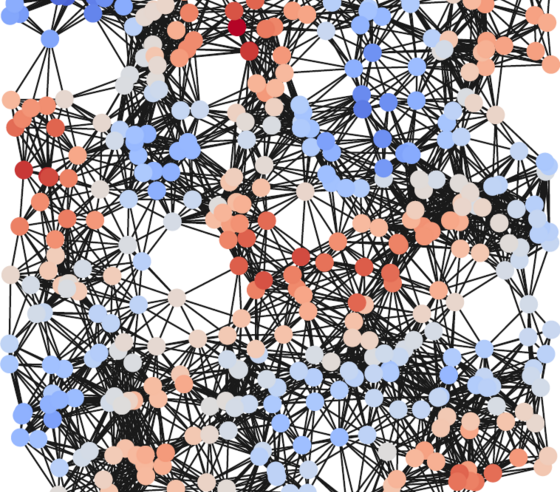
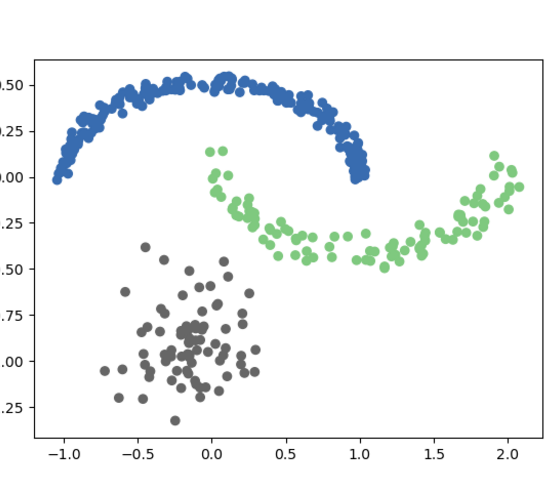
We study different matrix representations of graphs, in particular the adjacency matrix and the graph Laplacian, and will learn how the eigenvalues and eigenvectors of those matrices reveal combinatorial properties of the graph (and can thus subsequently help analyze and structure the underlying data). Among other things, we learn how spectral information can be used to find clusters/communities in a graph, identify the most important nodes or even neatly draw the graph for visualization.
The second part of the course deals with the analysis and manipulation of graph signals. The techniques used in this context can be interpreted as methods from classical digital signal processing (like the Fourier transform, band-pass filters, FIR filters, ...), generalized from very regular data (samples taken from a signal at equidistant points in time) to data living on arbitrary, possibly highly irregular domains, represented by graphs.
We start by investigating what a sensible concept of frequencies on a graph is and then consider classical topics such as denoising signals that are polluted by measurement errors and smoothing signals by applying appropriate filters. More advanced topics include reconstruction of partially observed signals (compressed sensing) and automatically learning unknown graph structures in order to explain observed data.
The topics of this course interconnect many areas of computer science and applied mathematics, including linear algebra, numerical mathematics, optimization, graph theory, data mining and machine learning. Throughout the course, we illustrate all concepts using Python implementations in Jupyter notebooks.
Grading and final exam
Instead of weekly homework, there will be two larger programming projects (spanning several weeks) over the course of the semester. In these, the learned concepts and techniques are practiced and applied to real-world data. Successfully completing these tasks will be required to be eligible for the exam. The projects can be done together in groups of 3-4 students.
At the end of the semester, there is an oral examination covering the theoretical contents of the course.
In order to pass the course, both projects and the final exam need to be passed.
Syllabus
Spectral Graph Theory
- Adjacency matrices and the graph Laplacian
- Algebraic connectivity and the Fiedler vector
- Spectral clustering
- Network centrality/communicability measures
- Spectral graph drawing
Graph Signal Processing
- Diffusion processes on graphs
- The graph Fourier transform
- Signal filtering on graphs
- Compressive sensing on graphs
- Learning graphs from data
Sample applications
- Community detection in complex networks
- Weather data analysis
- Detecting corrupted measurements from sensor networks
- Efficient exploration of complex networks